Error Tracking (FREE ALL)
Error Tracking allows developers to discover and view errors generated by their application. Because error information is surfaced where the code is developed, this increases efficiency and awareness. Users can choose between GitLab Integrated error tracking and Sentry based backends.
To leave feedback about Error Tracking bugs or functionality, comment in the feedback issue or open a new issue.
How error tracking works
For error tracking to work, you need:
-
Your application configured with the Sentry SDK: when the error happens, Sentry SDK captures information about it and sends it over the network to the backend. The backend stores information about all errors.
-
Error tracking backend: the backend can be either GitLab itself or Sentry. When it's GitLab, you name it integrated error tracking because you don't need to set up a separate backend. It's already part of the product.
- To use the GitLab backend, see integrated error tracking.
- To use Sentry as the backend, see Sentry error tracking.
Whatever backend you choose, the error tracking UI is the same.
Integrated error tracking (FREE SAAS)
This guide provides you with basics of setting up error tracking for your project, using examples from different languages.
Error tracking provided by GitLab Observability is based on Sentry SDK. Check the Sentry SDK documentation for more thorough examples of how you can use Sentry SDK in your application.
According to the Sentry data model, the item types are:
- Event
- Transactions
- Attachments
- Session
- Sessions
- User feedback (also known as user report)
- Client report
Enable error tracking for a project
Regardless of the programming language you use, you first need to enable error tracking for your GitLab project.
The GitLab.com instance is used in this guide.
Prerequisites:
- You have a project for which you want to enable error tracking. To learn how to create a new one, see Create a project.
To enable error tracking with GitLab as the backend:
-
In your project, go to Settings > Monitor.
-
Expand Error Tracking.
-
Under Enable error tracking, select the Active checkbox.
-
Under Error tracking backend, select GitLab.
-
Select Save changes.
-
Copy the Data Source Name (DSN) string. You need it for configuring your SDK implementation.
Error tracking list
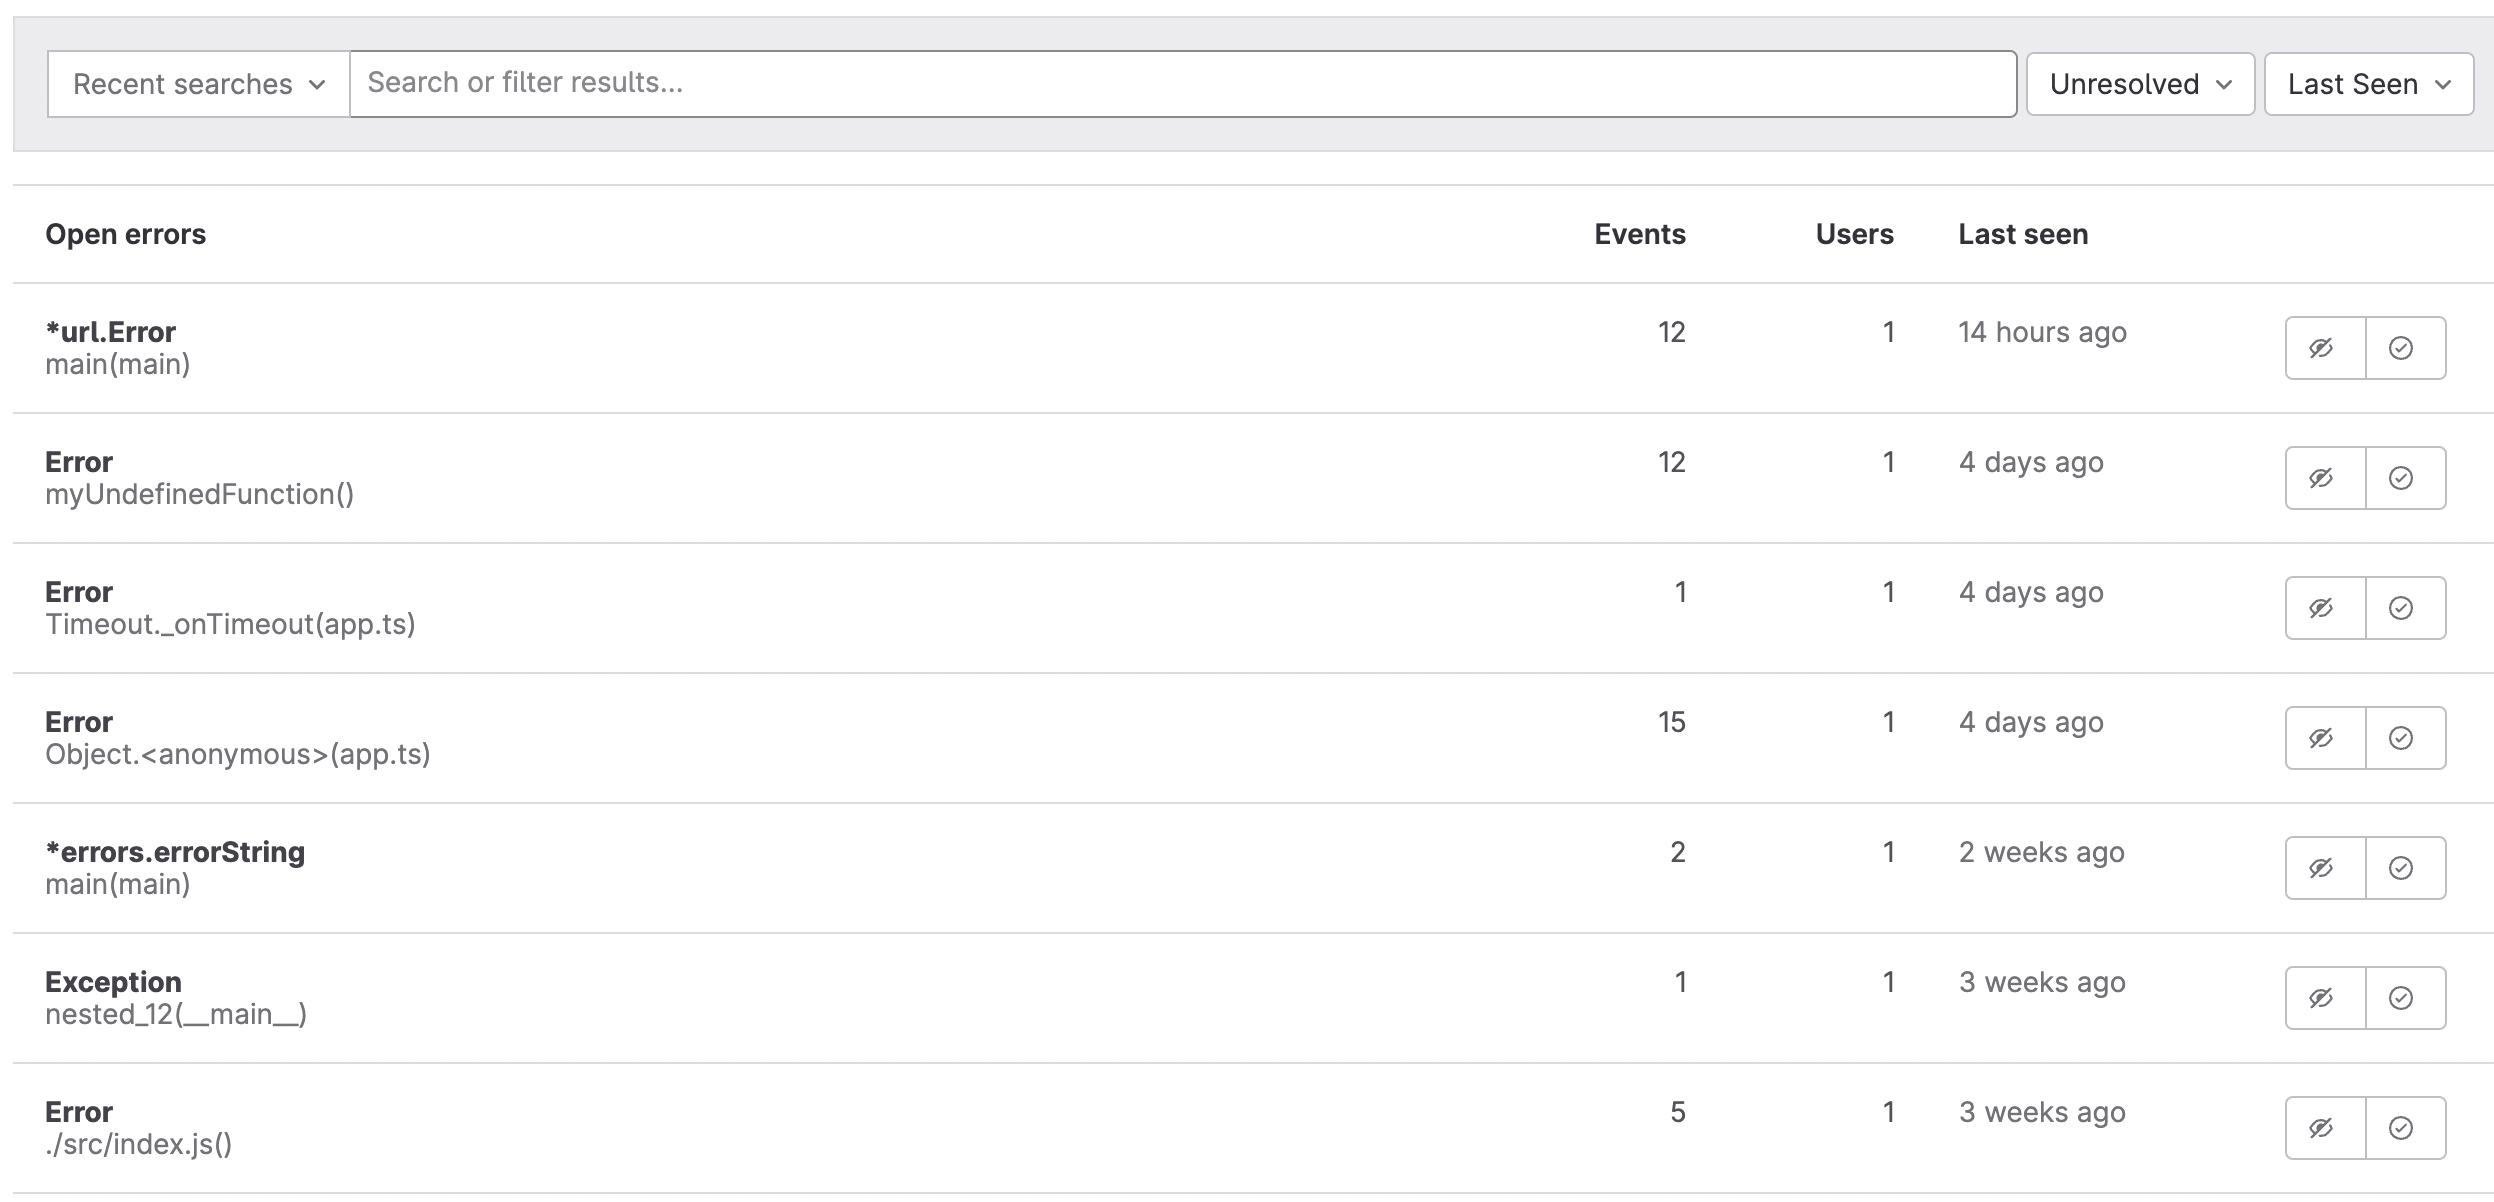
After your application has emitted errors to the Error Tracking API through the Sentry SDK, they should be available under the Monitor > Error Tracking tab/section.
Error tracking details
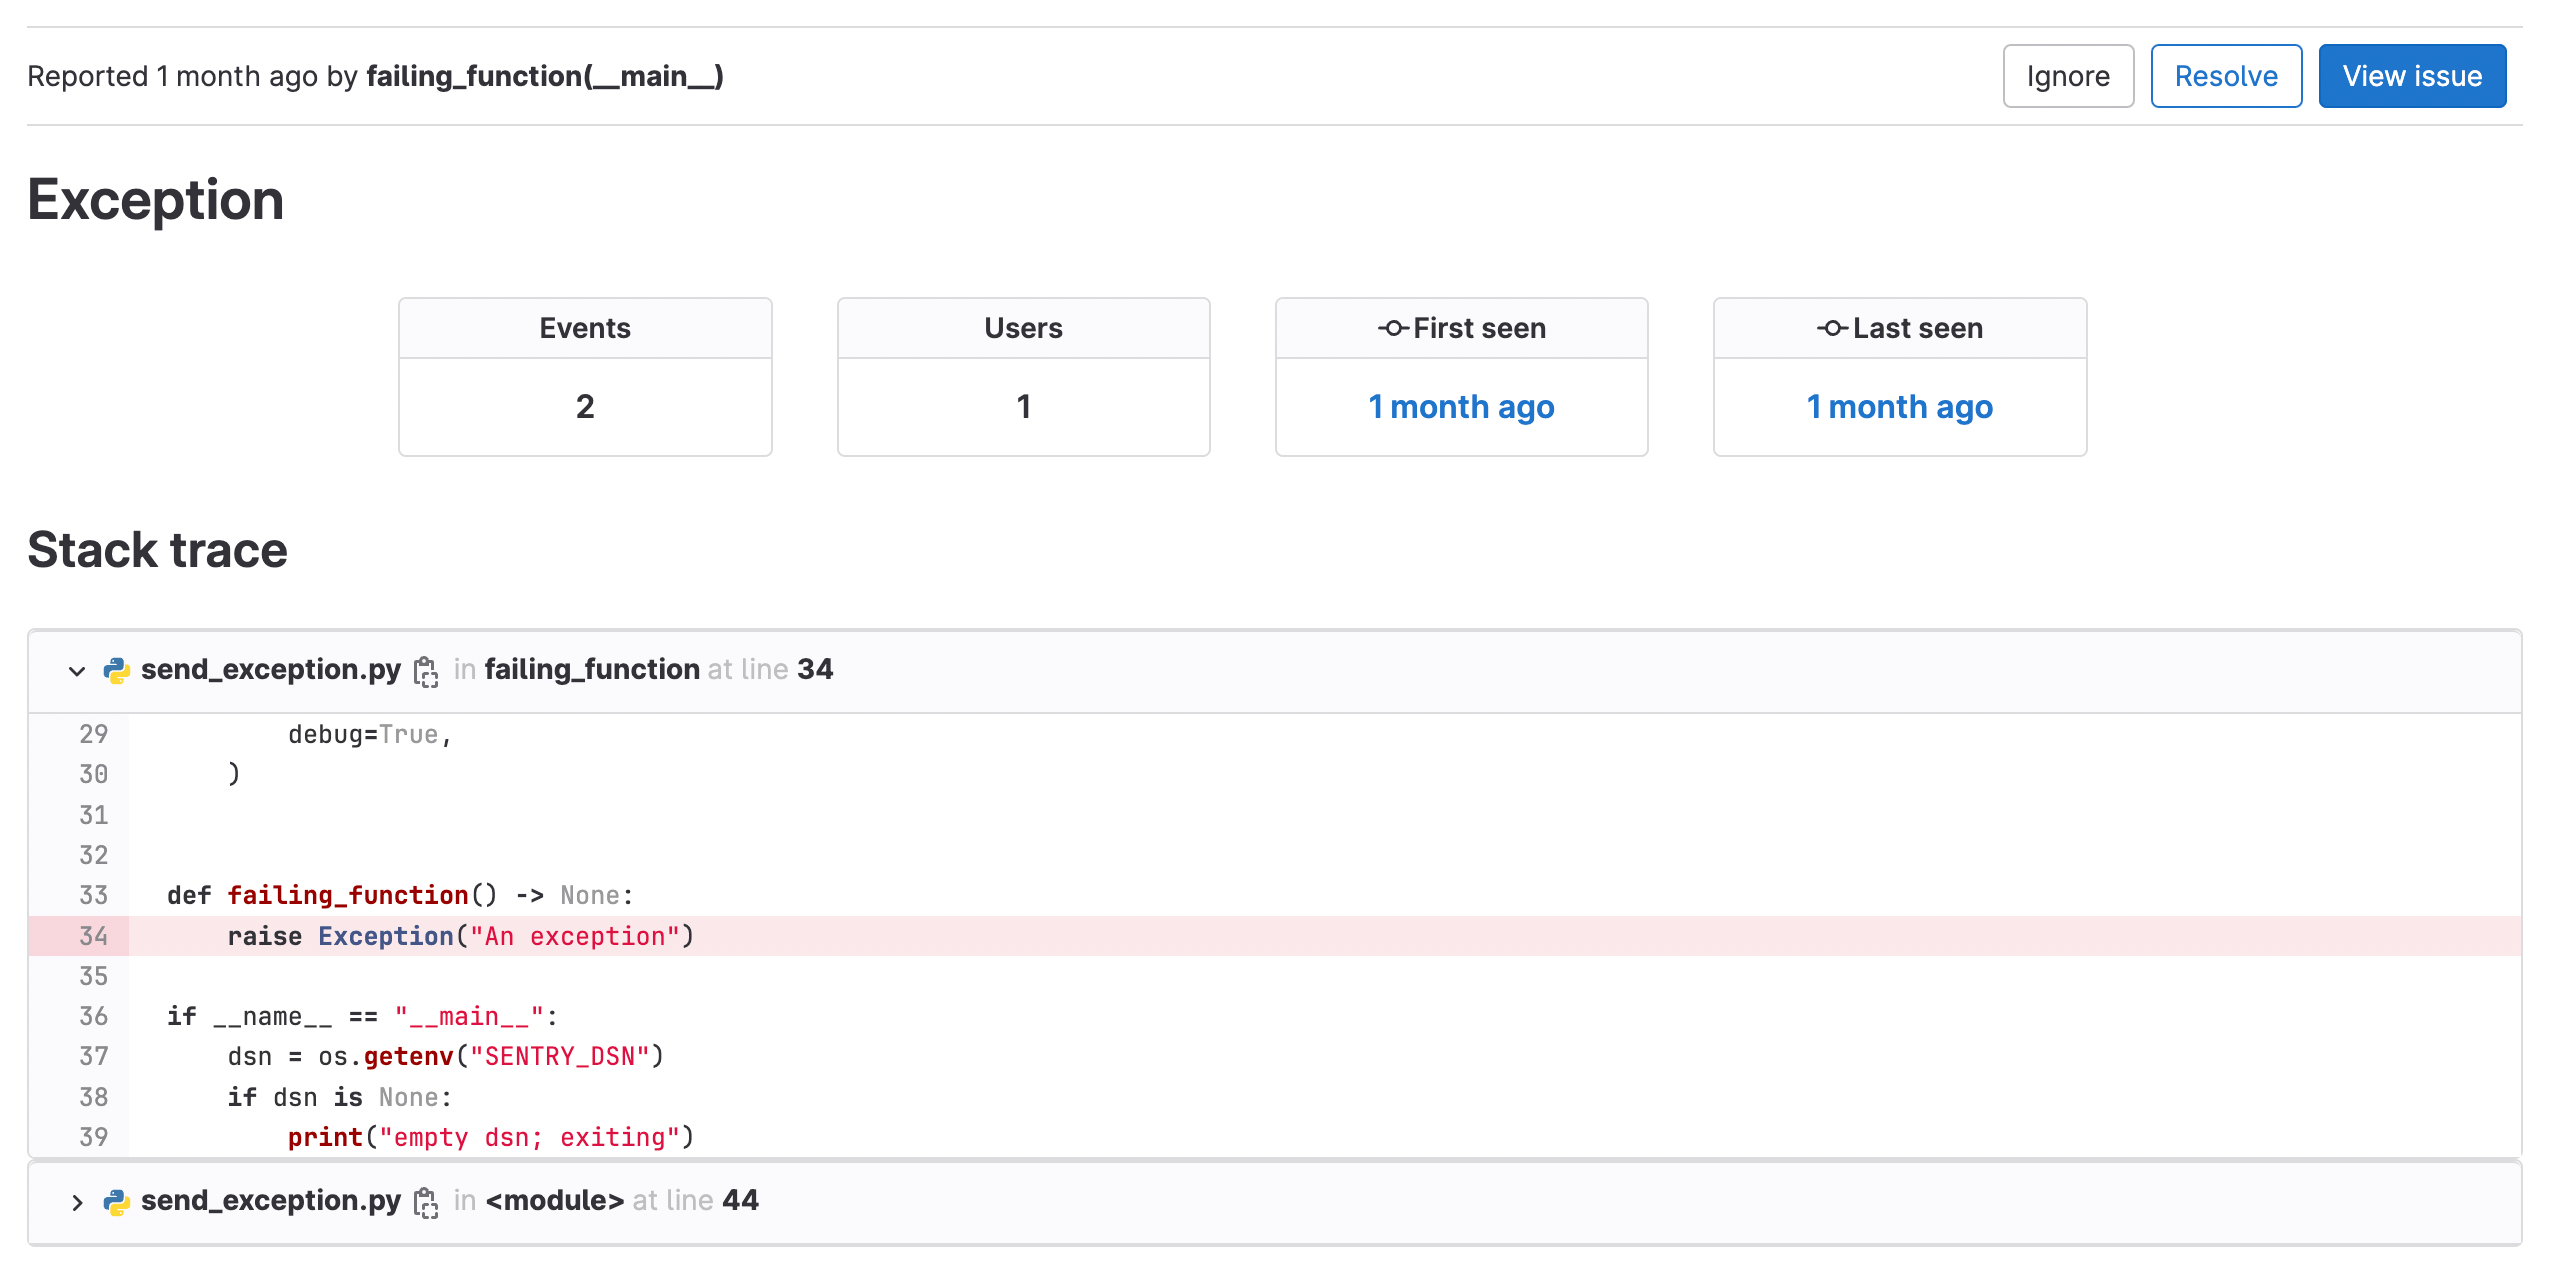
In the Error Details view you can see more details of the exception, including number of occurrences, users affected, first seen, and last seen dates.
You can also review the stack trace.
Emit errors
Supported language SDKs & Sentry types
The following table lists all event types available through Sentry SDK, and whether they are supported by GitLab Error Tracking.
| Language | Tested SDK client and version | Endpoint | Supported item types |
|---|---|---|---|
| Go | sentry-go/0.20.0 |
store |
exception, message
|
| Java | sentry.java:6.18.1 |
envelope |
exception, message
|
| NodeJS | sentry.javascript.node:7.38.0 |
envelope |
exception, message
|
| PHP | sentry.php/3.18.0 |
store |
exception, message
|
| Python | sentry.python/1.21.0 |
envelope |
exception, message, session
|
| Ruby | sentry.ruby:5.9.0 |
envelope |
exception, message
|
| Rust | sentry.rust/0.31.0 |
envelope |
exception, message, session
|
For a detailed version of this table, see this issue.
Usage examples
You can also find working samples for all supported language SDKs. Each listed program shows a basic example of how to capture exceptions, events, or messages with the respective SDK.
For more in-depth documentation, see Sentry SDK's documentation specific to the used language.
Rotate generated DSN
The Sentry Data Source Name, or DSN, (client key) is a secret and it should not be exposed to the public. In case of a leak, rotate the Sentry DSN by following these steps:
-
Create an access token by selecting your profile picture in GitLab.com. Then select Preferences, and then Access Token. Make sure you add API scope.
-
Using the error tracking API, create a new Sentry DSN:
curl --request POST --header "PRIVATE-TOKEN: <your_access_token>" --header "Content-Type: application/json" \ "https://gitlab.example.com/api/v4/projects/<your_project_number>/error_tracking/client_keys" -
Get the available client keys (Sentry DSNs). Ensure that the newly created Sentry DSN is in place. Then note down the key ID of the old client key:
curl --header "PRIVATE-TOKEN: <your_access_token>" "https://gitlab.example.com/api/v4/projects/<your_project_number>/error_tracking/client_keys" -
Delete the old client key.
curl --request DELETE --header "PRIVATE-TOKEN: <your_access_token>" "https://gitlab.example.com/api/v4/projects/<your_project_number>/error_tracking/client_keys/<key_id>"
Debug SDK issues
The majority of languages supported by Sentry expose debug option as part of initialization.
This can be helpful when debugging issues with sending errors. Otherwise,
there are options that could allow outputting JSON before it is sent to the API.
Sentry error tracking
Sentry is an open source error tracking system. GitLab allows administrators to connect Sentry to GitLab so users can view a list of Sentry errors in GitLab.
Deploying Sentry
You can sign up to the cloud-hosted Sentry or deploy your own on-premise instance.
Enable Sentry integration for a project
GitLab provides a way to connect Sentry to your project.
Prerequisites:
- You must have at least the Maintainer role for the project.
To enable the Sentry integration:
- Sign up to Sentry.io or deploy your own Sentry instance.
- Create a new Sentry project. For each GitLab project that you want to integrate, you should create a new Sentry project.
- Find or generate a Sentry auth token.
For the SaaS version of Sentry, you can find or generate the auth token at https://sentry.io/api/.
You should give the token at least the following scopes:
project:read,event:read, andevent:write(for resolving events). - In GitLab, enable and configure Error Tracking:
- On the left sidebar, select Search or go to and find your project.
- Select Settings > Monitor > Error Tracking.
- Under Enable error tracking, select the Active checkbox.
- Under Error tracking backend, select Sentry.
- Under Sentry API URL, enter your Sentry hostname. For example,
enter
https://sentry.example.com. For the SaaS version of Sentry, the hostname ishttps://sentry.io. - Under Auth Token, enter the token you previously generated.
- To test the connection to Sentry and populate the Project dropdown list, select Connect.
- From the Project list, choose a Sentry project to link to your GitLab project.
- Select Save changes.
You can now visit Monitor > Error Tracking in your project's sidebar to view a list of Sentry errors.
Sentry's GitLab integration
You might also want to enable Sentry's GitLab integration by following the steps in the Sentry documentation.
Enable GitLab Runner
To configure GitLab Runner with Sentry, you must add the value for sentry_dsn
to your runner's config.toml configuration file, as referenced in
Advanced configuration.
If you're asked for the project type while setting up Sentry, select Go.
To rectify the following error, specify the deprecated DSN in Sentry.io > Project Settings > Client Keys (DSN) > Show deprecated DSN.
ERROR: Sentry failure builds=0 error=raven: dsn missing private keyTroubleshooting
When working with Error Tracking, you might encounter the following issues.
Error Connection failed. Check auth token and try again
If the Monitor feature is disabled in the project settings,
you might see an error when you try to enable Sentry integration for a project.
The resulting request to /project/path/-/error_tracking/projects.json?api_host=https:%2F%2Fsentry.example.com%2F&token=<token> returns a 404 status.
To fix this issue, enable the Monitor feature for the project.

